Walmart Sales Analysis Interactive Sales Dashboard
For the retail stores in the US

For the retail stores in the US
This project is an analysis of the commercial performance of a chain of stores that sales technological furnitures and office furnitures all over US: Walmart. Through the analysis, we was trying to answer some business questions related to the performance of the sales departement.
Where is the business making profit and where is it not? Which cities are in trouble? What are the best sellers? Which client segment generates the most profit?
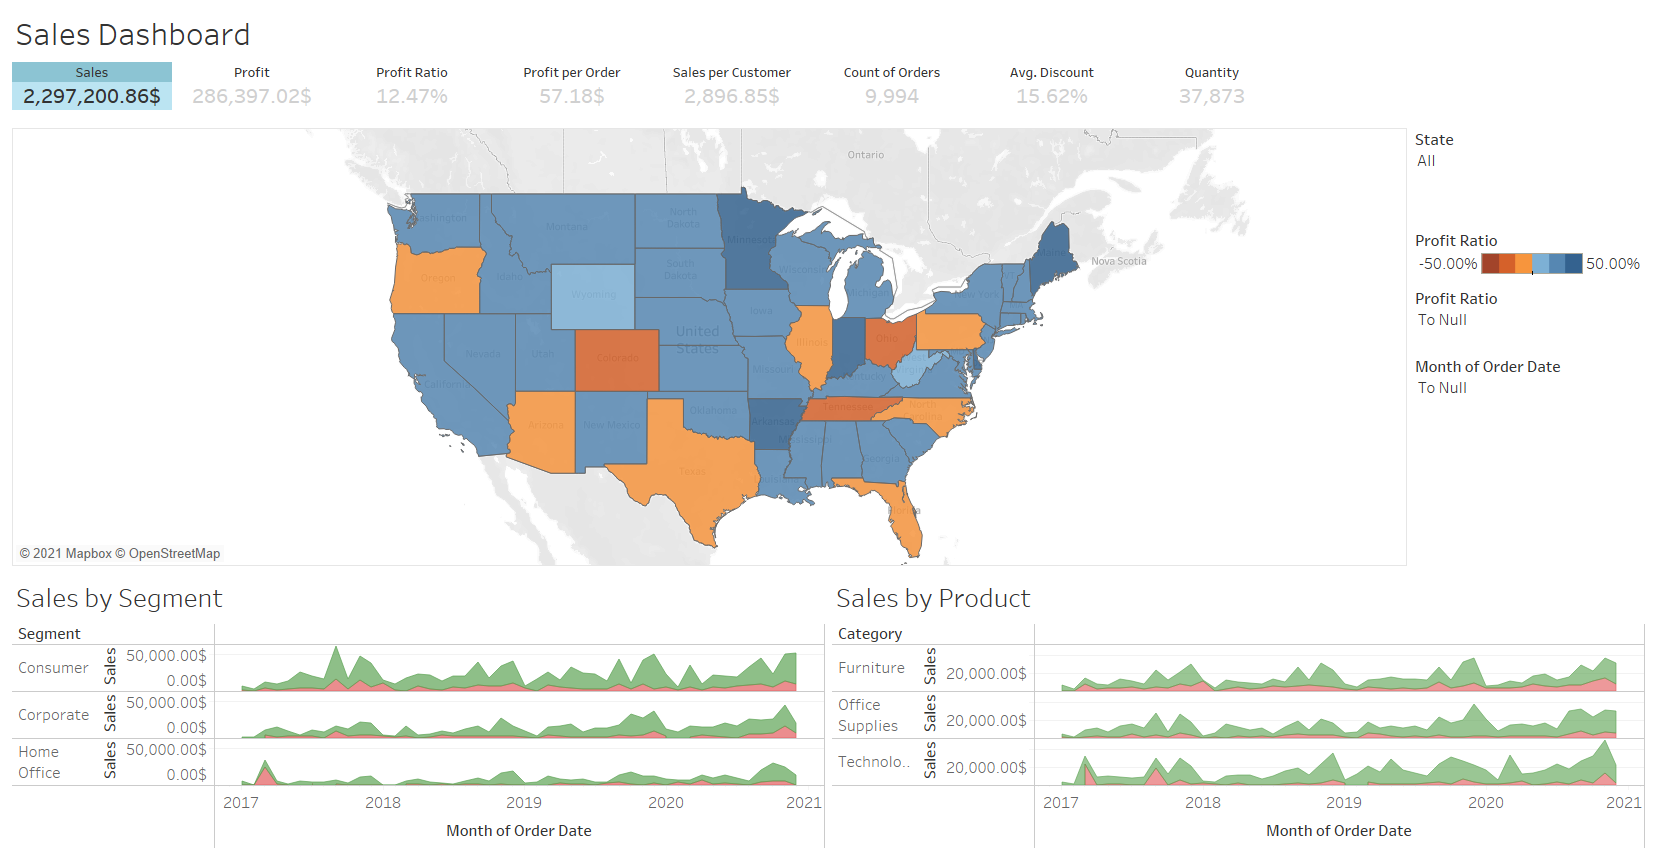
To summarize the analysis and help shareholders monitor the commercial activity, I designed this interactive dashboard using Tableau software.
Here is the link to the dataset.
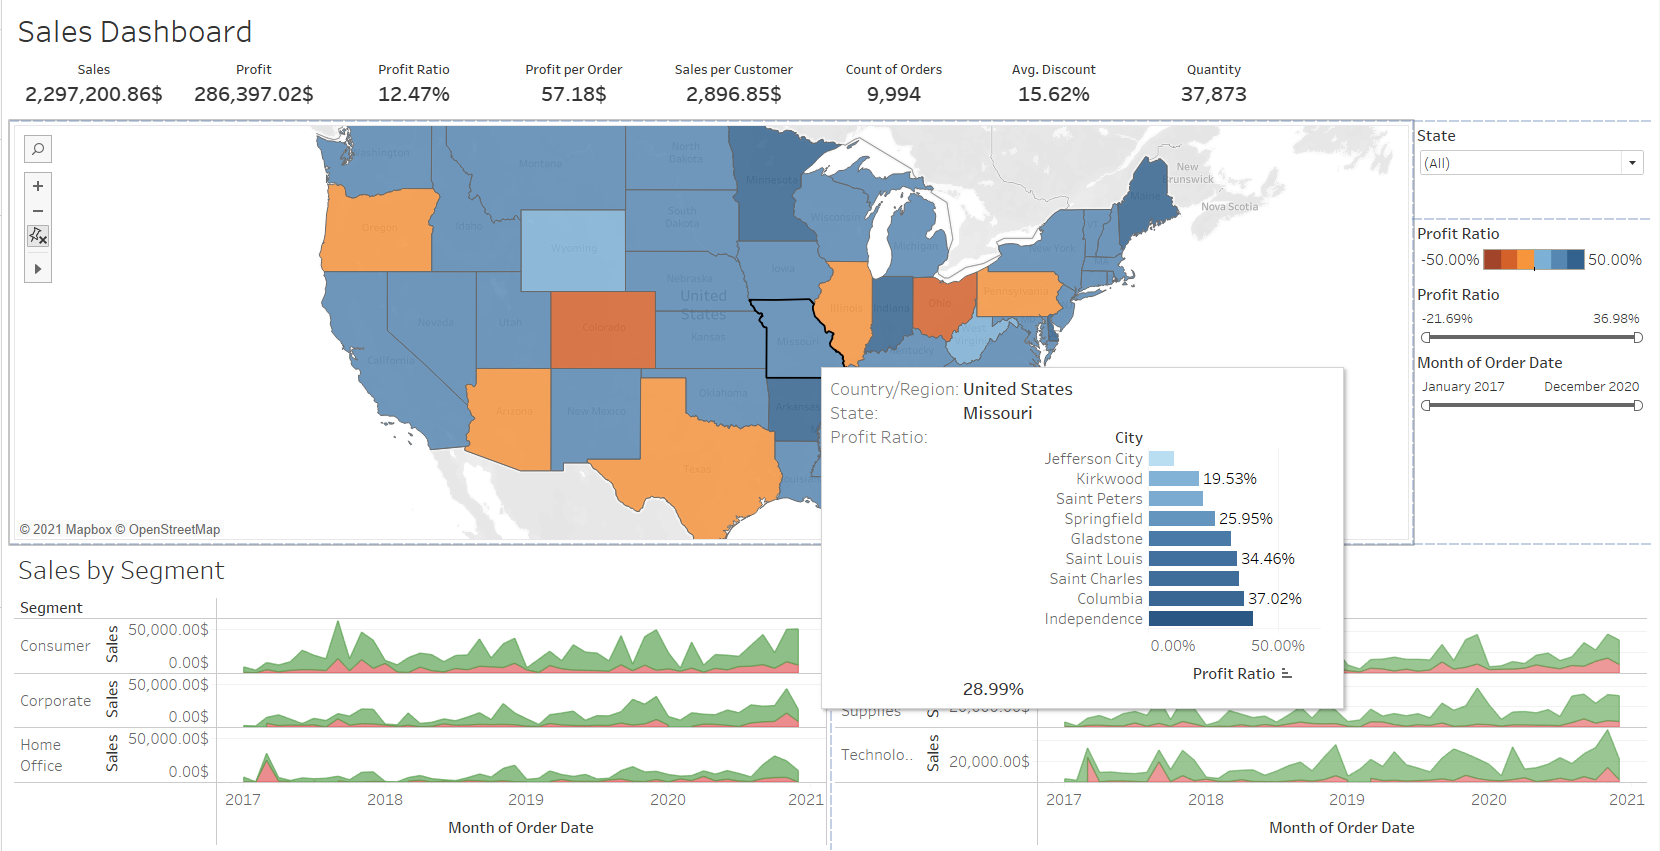
The dashboard integrates 05 metrics (KPIs, Sales by segment, Sales by product, profit ratio by city) alongside with specific filters. This combination allows indepth analysis of the sales since the filters are cumulative.
 *
*
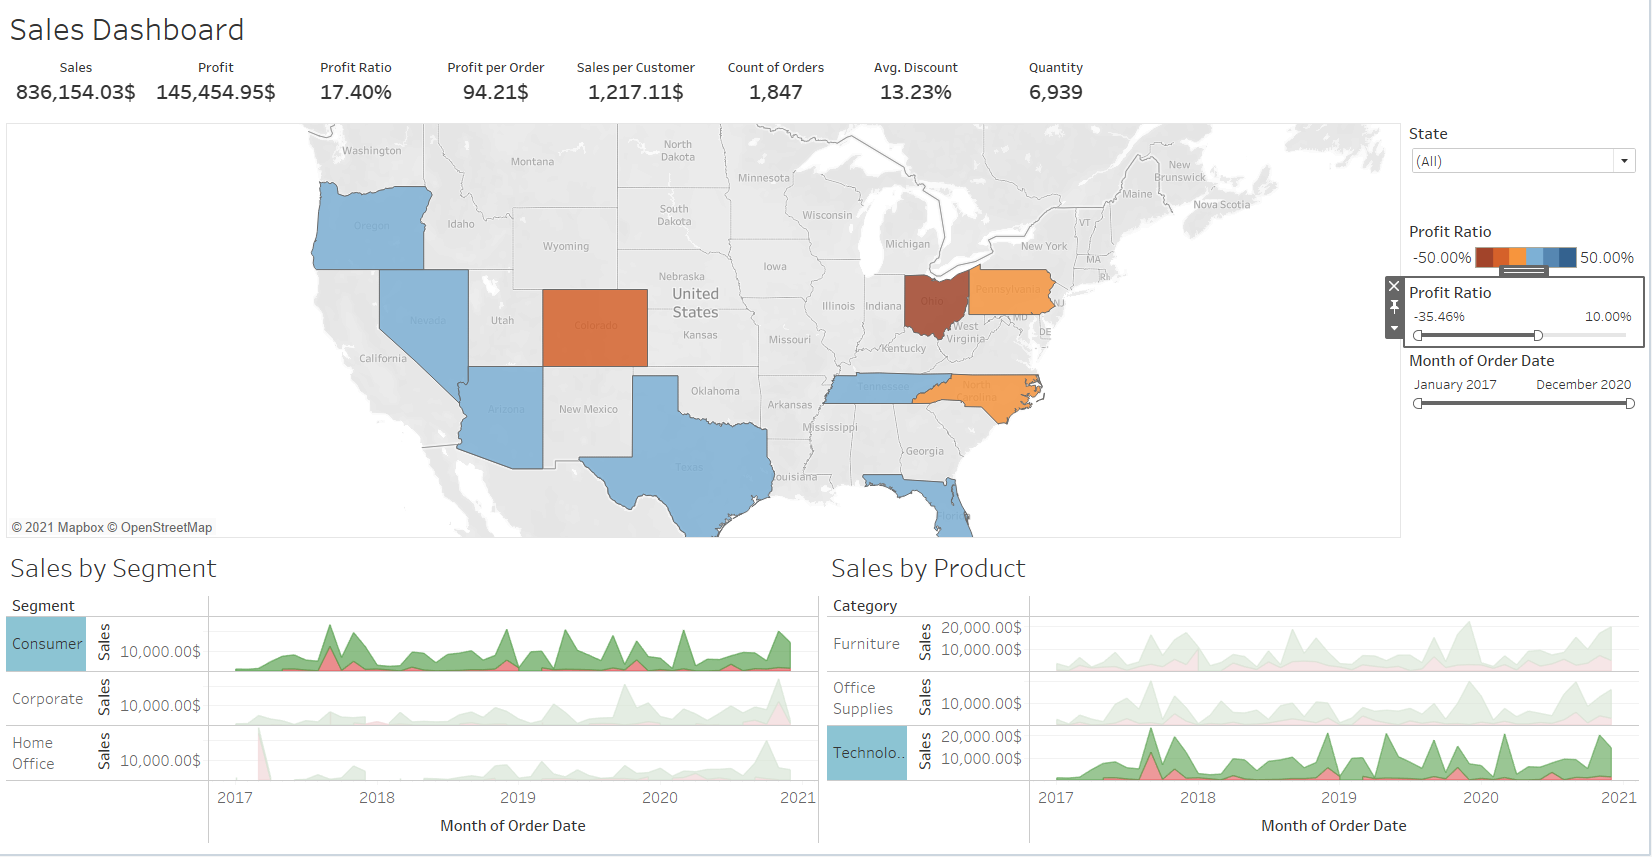
For example, here is a visualization of the profit ratio, for the sales of technology product, based on the Consumer segment, for states where the Profit Ratio is less or equal to 10%.
This project was carried out as part of my studies.